How to Track Content Performance Like a Marketing Pro

14 mins
6/13/2025
Joe Ervin
- how to track content performance
- content analytics
- marketing metrics
- content measurement
- content ROI
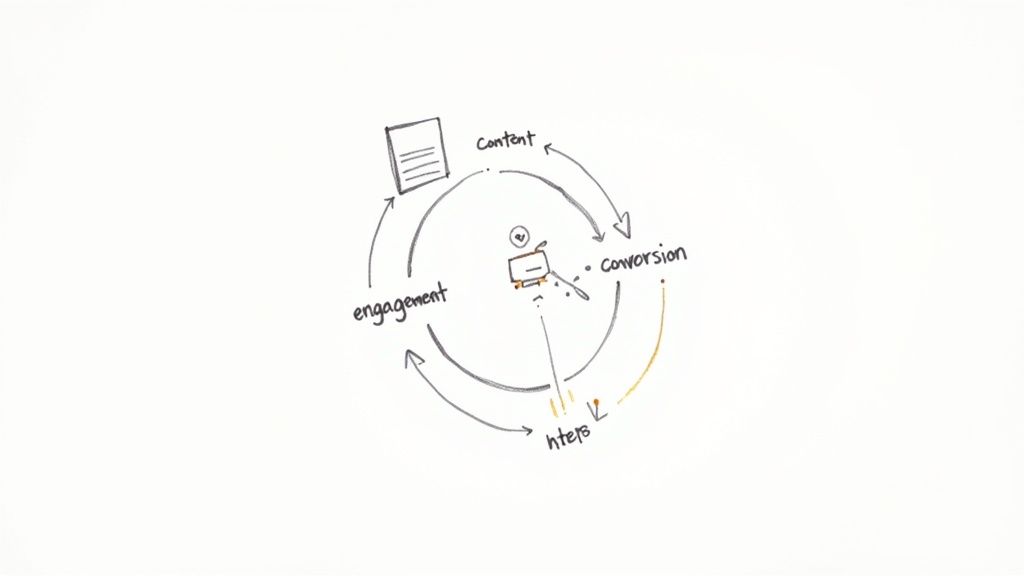
What Really Moves the Needle in Content Performance
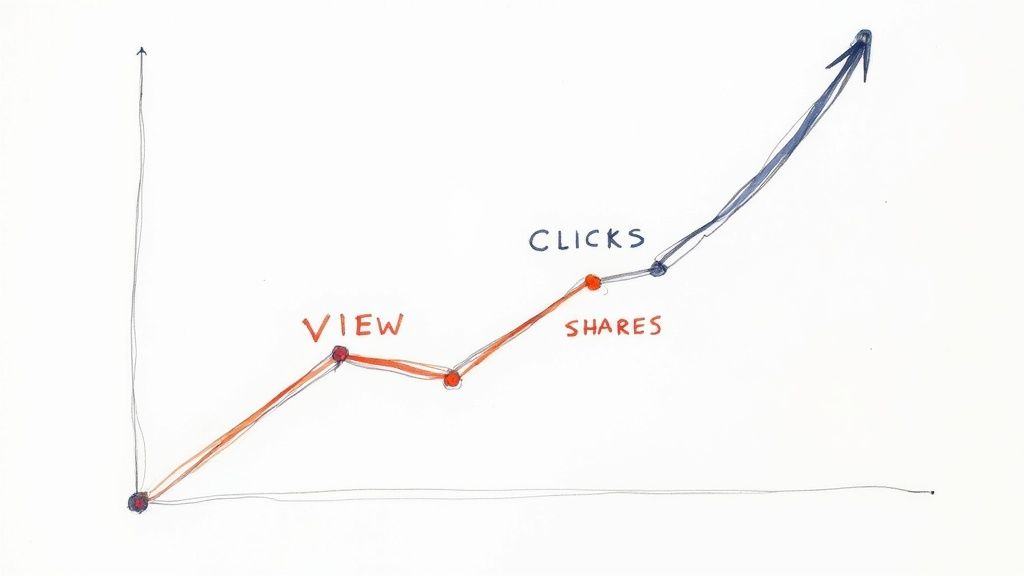
After years of tracking content, I've realized something important: most people are measuring the wrong things. I've chatted with plenty of experienced marketing folks who've discovered that vanity metrics—things like page views and social shares—rarely translate into actual business growth. It's kind of like judging a book by its cover. You might have a gorgeous cover, but the story inside could be a total flop.
So, what should you be tracking? It all comes down to figuring out what actually matters for your specific business. If you're running a startup, building brand awareness is critical. That means metrics like organic search traffic and social media engagement are your best friends. On the other hand, if you're working with an established company, driving conversions and customer lifetime value are probably your bread and butter. Think of it like building a house – the foundation needs to be rock-solid before you even think about paint colors.
One thing I’ve learned is the power of engagement depth. While those surface-level metrics can be tempting to fixate on, the real gold lies in understanding how people really interact with your content. For example, are people scrolling all the way through your blog posts? Are they clicking on your calls to action? These behaviors tell you way more about your content's effectiveness than just counting page views.
It’s also interesting to note that content performance metrics can vary a lot based on the type of business. For new or small businesses, things like brand awareness and content shares are vital for just getting your name out there. Established businesses, however, usually prioritize lead generation and customer retention. And if you're an eCommerce company? Conversion rates and customer lifetime value are probably top of mind. Tailoring your metrics to your specific needs is absolutely crucial for a targeted content strategy.
To illustrate this point, let's look at a few different business types and their corresponding metrics.
Here’s a table to help break down the differences:
| Business Type | Primary Metrics | Secondary Metrics | Key Focus |
|---|---|---|---|
| Startup/Small Business | Brand awareness (social mentions, website traffic), Content shares | Lead generation, Conversion rate | Building a brand presence and initial traction |
| Established Business | Lead generation, Customer retention rate | Customer lifetime value, Sales revenue | Driving qualified leads and fostering customer loyalty |
| eCommerce Business | Conversion rate, Customer lifetime value | Average order value, Cart abandonment rate | Maximizing sales and profitability |
As you can see, the focus shifts dramatically depending on the stage and type of business. A startup needs to get its name out there, while an established business needs to nurture existing customers and drive new leads. eCommerce is all about the bottom line - making sales and increasing customer value.
For a more in-depth look at content metrics, check out this helpful resource: Discover more insights about content metrics.
At the end of the day, resist the urge to build a dashboard packed with every metric under the sun. Instead, focus on the few key metrics that truly align with your business goals. This clarity will help you make smart, data-driven decisions that actually move the needle for your bottom line. This is something we really emphasize at Trace, where we believe in simple systems that actually get results. We focus on the fundamentals and cut out unnecessary complexity so you can truly understand what drives your business forward.
Building Your Content Tracking Foundation That Actually Works
Let's be honest, diving headfirst into fancy analytics without a solid tracking foundation is like building a house on sand. I've seen it happen way too often, and trust me, it's not pretty. So, before we get to the really exciting stuff, let’s lay down some groundwork. Think of this as setting up the tools of the trade, like a seasoned carpenter getting their toolkit ready. We’ll cover everything from basic Google Analytics setups to the power of UTM parameters. The goal? Building a system that grows with you, not against you.
This screenshot shows a standard Google Analytics dashboard. It's like your mission control, giving you a bird's-eye view of website traffic and key metrics. You can instantly see where your traffic originates, which pages are getting all the love, and how people are actually interacting with your site.
One of the biggest stumbling blocks I've seen is inconsistent naming. Imagine sifting through data where some campaigns are labeled "Spring Sale" and others "Spring_Sale_2024." It's a data analyst's worst nightmare! From day one, establish clear, consistent naming rules. Your future self will thank you.
Setting Up Goals in Google Analytics
Similarly, a poorly planned goal structure in Google Analytics is a recipe for disaster. You'll end up with a bunch of data that’s about as useful as a chocolate teapot. Before you even think about setting up goals, map out your main objectives and make sure they align with your overall business strategy. By the way, if you're looking to automate some of this, check out our guide on marketing automation for ecommerce.
Tracking content performance is like having a secret weapon. It helps you fine-tune your strategies and squeeze every last drop of ROI out of your efforts. Did you know that by 2025, 46% of B2B marketers are planning to boost their content marketing budgets? Discover more insights about content budgets. This just goes to show how vital effective performance measurement really is. You need a system that can handle the ever-increasing data deluge.
Organizing Your Tracking
Another crucial piece of the puzzle is creating an organizational system that keeps your tracking manageable. I've worked with teams who swear by shared spreadsheets, while others prefer project management tools or even custom-built databases to organize their UTM parameters and keep their data squeaky clean. The secret sauce? Find a system that clicks with your team and stick with it.
Don't forget about regular audits! Every few months, give your tracking setup a thorough check-up. Make sure it’s still in sync with your goals and hasn't accumulated any sneaky inconsistencies. This proactive approach protects your data integrity and gives you a rock-solid base for making smart content decisions.
Mastering Cross-Platform Tracking Without Losing Your Mind
Let's be honest, keeping track of your content's performance across your website, social media, email lists, and ads can feel like herding cats. But trust me, it doesn't have to be a chaotic mess. I've worked with plenty of marketing teams who've nailed this, and the secret is a unified tracking system. Ditch the multiple dashboards and embrace streamlined simplicity.
One of the biggest mistakes I see is treating each platform like a separate island. Think of your content as having a journey, flowing through an interconnected ecosystem. A blog post might get shared on Twitter, leading folks back to your website, where they then sign up for your email list. Tracking that entire flow, from tweet to signup, is how you unlock the true story of your content’s impact. At Trace, we're all about making these connections clear and easy.
Connecting the Dots Between Platforms
Getting a handle on cross-platform tracking means understanding the strengths of each channel. Google Analytics is your go-to for a broad overview of website traffic, but diving into platform-specific tools like Facebook Insights or Twitter Analytics gives you that granular view of audience behavior on those networks. It helps you see which content truly resonates on each platform.
Content format matters, too. You might have a YouTube video racking up views, but are those viewers clicking through to your website? Maybe your Instagram posts get tons of engagement, but is that translating into actual sales? Consistent tracking is key to answering these questions.
I once worked with a skincare brand that was surprised to find their quietest social platform, Pinterest, was actually sending their highest-converting traffic. That single insight completely shifted their strategy and resources, leading to some seriously impressive results. Measuring content performance also means recognizing the differences in platforms and content types. You've got website content (blog posts, landing pages), social media content (Facebook, YouTube, Instagram), and campaign content (emails, ads, eBooks). Learn more about measuring content performance here. Every platform has its own unique set of metrics. The trick is figuring out which Key Performance Indicators (KPIs) align with your business goals. For example, social media engagement metrics like likes, comments, and shares are essential for understanding audience interaction on platforms like Facebook and Instagram. Use these metrics, build reports to track them, and you’ll automate the process of evaluating your content's performance across the board. This makes analysis way more efficient, so you can actually use that data to refine your content strategy.
Consistent measurement is your best friend here. It's like using the same ruler to measure different objects – it gives you a reliable benchmark for comparison. This way, you can compare “apples to apples” across your content and platforms, and clearly see which ones are bringing the most value to your business.
To help visualize this, check out this table summarizing key metrics for different platforms:
To help you visualize which metrics to track where, I’ve put together this handy table:
Platform-Specific Key Performance Indicators: Essential metrics to track for each content platform and channel
| Platform | Primary KPIs | Tracking Method | Success Benchmarks |
|---|---|---|---|
| Website (Blog, Landing Pages) | Traffic, Conversion Rate, Time on Page, Bounce Rate | Google Analytics | Varies based on industry and goals (e.g., >2% conversion rate, <40% bounce rate) |
| Reach, Engagement (likes, comments, shares), Click-Through Rate | Facebook Insights | Varies based on industry and content type; track growth over time | |
| Reach, Engagement (likes, comments, shares, saves), Website Clicks | Instagram Insights | Similar to Facebook, focus on engagement growth and website traffic | |
| Impressions, Engagement (retweets, likes, replies), Website Clicks | Twitter Analytics | Track impressions, engagement rate, and referral traffic to your website | |
| YouTube | Views, Watch Time, Click-Through Rate (to website or other content) | YouTube Analytics | Focus on increasing watch time and driving traffic to other platforms |
| Email Newsletters | Open Rate, Click-Through Rate, Conversion Rate | Email Marketing Platform (e.g., Mailchimp) | Benchmarks vary, but aim for high open rates (>20%) and click-through rates (>2%) |
This table helps you quickly see which metrics truly matter for each platform, giving you a starting point for building your own tracking dashboard. Remember, the benchmarks I mentioned are just examples - what counts as "success" will depend on your specific goals and industry. The most important thing is to track consistently and look for trends over time. By focusing on the right metrics, you can start to see the bigger picture of your content's performance and make smarter decisions about where to invest your time and resources.
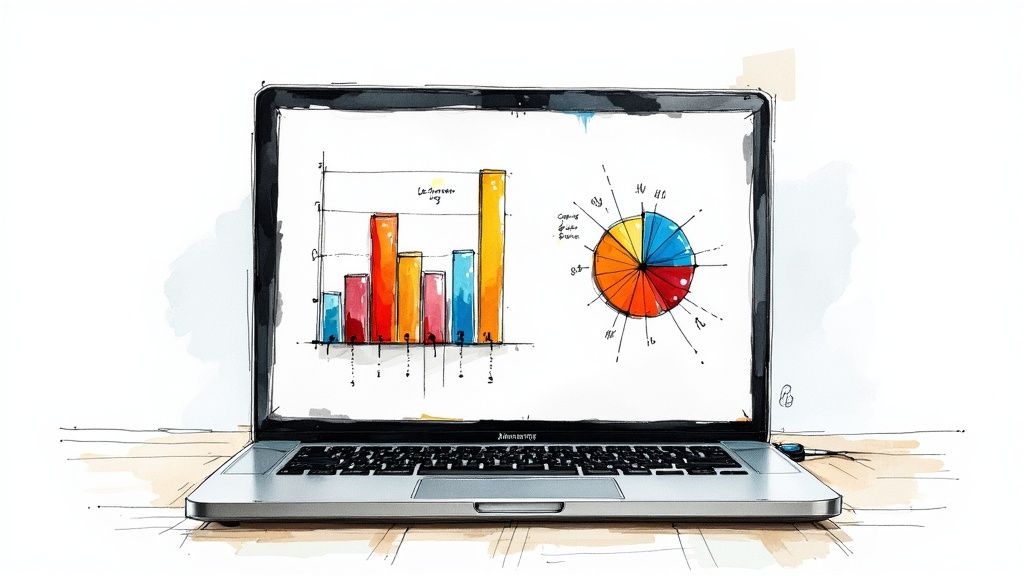
Creating Dashboards People Actually Want to Check
I've seen countless dashboards become nothing more than digital dust collectors. Often, they’re visually appealing, filled with charts and graphs, but completely forgotten after the initial excitement wears off. The key to a dashboard that actually gets used? It needs to tell a story. It shouldn't just display numbers; it should reveal insights. Think of it like a compelling detective novel – the data is the evidence, and your dashboard is the narrative that connects all the dots.
This is a sample dashboard from Google Data Studio. Notice how it visually represents key metrics like website traffic, conversion rates, and social media engagement. It’s designed to provide a quick overview of overall performance. With a single glance, you can identify strengths, weaknesses, emerging trends, and potential opportunities.
So, how do you create a dashboard that people actually want to use? Let's learn from successful marketing teams. They've mastered the art of building reporting systems that truly inform decision-making and capture the regular attention of everyone, from the CEO to the content creators. For example, one team I collaborated with focused on highlighting key trends and opportunities instead of bombarding viewers with every single data point. They used clear visualizations and simple language that everyone could understand, making their dashboard the ultimate source for content performance insights.
Designing Dashboards That Tell a Story
One common mistake is building a one-size-fits-all dashboard. Remember, different stakeholders have different needs. Executives want a high-level overview, while content managers crave detailed performance trends. Consider tailoring your dashboards for these different audiences. An executive summary dashboard might focus on key metrics like overall website traffic, lead generation, and conversion rates. On the other hand, a content manager’s dashboard might delve deeper into individual content performance, engagement metrics, and data from tools like Google Analytics. You could even consider how this ties into improving your customer's journey.
I once worked with a clothing brand that implemented this tiered approach, creating separate dashboards for their executive team, marketing managers, and content creators. The impact was immediate. Executives could quickly grasp the overall influence of their content, managers could effectively track progress towards their goals, and creators could directly see the results of their work. It's like providing everyone with the right tools for their specific job – it empowers them to make informed decisions.
Visualizing Insights for Actionable Decisions
Another critical aspect of effective dashboard design is choosing the right visualizations. Don't just dump data onto a page – carefully consider how visuals can help people understand the information. Line graphs are excellent for showing trends over time, bar charts effectively compare performance across different content pieces or channels, and pie charts clearly illustrate the breakdown of traffic sources or audience demographics.
Finally, remember that a dashboard isn't a static document. It's a dynamic tool for continuous monitoring and optimization. Encourage your team to use the dashboard to initiate discussions, analyze performance, and identify areas for improvement. Tracking content performance effectively is an ongoing process, not a one-time project. A well-designed dashboard helps you identify patterns, spot opportunities, and make data-driven decisions that deliver tangible results. This creates a positive feedback loop where insights from the dashboard lead to better content, which then leads to even richer and more insightful data.
Reading Your Data Like a Content Detective
I've spent countless hours staring at spreadsheets packed with numbers, feeling utterly clueless. Numbers without context? Just noise. The real magic of tracking content performance isn’t about collecting the data, it’s about knowing how to interpret it. Become a content detective, piecing together the clues hidden within the data to understand what's really going on.
This means training yourself to spot patterns. Notice if certain content types consistently outperform others. See if there's a relationship between content length and engagement. These patterns can unlock valuable insights into what your audience actually wants. I once worked with a company that discovered their audience loved short, engaging videos. It wasn't obvious from the initial view counts. By digging deeper into metrics like watch time and shares, they uncovered this golden nugget.
Identifying Early Warning Signs and Opportunities
Besides patterns, tracking content performance is about catching problems early. A small dip in engagement might seem minor, but it could be a canary in the coal mine. Addressing these dips early can prevent a bigger issue down the road. Think of it like a small leak in your roof—a quick fix now avoids major damage later.
On the flip side, data analysis can reveal hidden opportunities. Perhaps a blog post is unexpectedly driving tons of traffic from a specific social media platform. This could point to an untapped audience or a highly effective promotion strategy. These insights can significantly boost engagement, conversions, and your overall content ROI. It's like stumbling upon a hidden treasure.
Separating Signal from Noise
One of the trickiest parts of data analysis is separating meaningful signals from the random fluctuations. Not every change in your metrics is a reason to panic. A traffic drop might be due to a holiday or a temporary technical glitch, not a problem with your content strategy. Learning to tell the difference between statistical blips and real trends is crucial. It's like tuning out the static on a radio to hear the music.
Resist the urge to react to short-term anomalies. Look for consistent patterns over time to identify real trends. A single day of high traffic from a particular source could be a coincidence. But if it continues for several weeks? That's worth investigating.
Turning Numbers into Actionable Intelligence
The ultimate goal is to transform raw data into actionable intelligence. This means developing an analytical mindset that goes beyond simply reporting metrics. Ask yourself why certain content performs well and how you can replicate that success. For example, if a blog post drives a ton of conversions, analyze its structure, tone, and calls to action to understand what resonates. Then, apply those learnings to future content.
Also, look for connections between your content performance and your overall business goals. Does increased website traffic correlate with higher sales? Does engaging social media content lead to more email signups? Understanding these connections proves the value of your content marketing efforts and helps get buy-in from stakeholders. By connecting content performance with customer behavior, you gain a deeper understanding of what motivates your audience to engage, convert, and ultimately, become loyal customers. This holistic approach transforms data into a powerful tool for making smart decisions.
Transforming Insights Into Content Strategy Gold
Data collection is the first step. The real value comes from turning that data into content that gets results. I've seen successful marketers use performance data to shape everything from brainstorming sessions to optimizing existing content. Think of it as a feedback loop: data informs decisions, and those decisions lead to better data.
Let's say a blog post isn't performing well. Don't delete it – investigate! Is the bounce rate high? The intro might need a rewrite. Low click-through rates on your calls to action? Maybe they aren't enticing enough. Small data-backed tweaks can make a big difference.
Testing and Optimizing Content For Continuous Improvement
A/B testing is a game-changer. Create two versions of your content with minor differences – a headline, a call to action, or even an image. Track which one performs better. It's like a mini-experiment to understand your audience. This helps you understand what truly resonates with them. Want a deeper dive into content strategy? Check out this post on Crafting a powerful ecommerce content strategy.
Always measure the impact of your changes. Don't just make changes and cross your fingers. Track the key metrics before and after. Did the headline tweak boost click-through rates? Did your new call to action drive more conversions? This data-focused approach keeps you on the right track.
Using Data To Guide Content Strategy and Resource Allocation
Performance tracking doesn't just improve individual pieces; it informs your overall content strategy. From topic selection and content formats to timing and promotion – everything can be guided by data. What if you found that your audience loves video content on Instagram? That might mean shifting resources toward creating more Instagram videos to boost reach and engagement.
Data is also your best friend for justifying budget and resources. Show stakeholders how your data-driven content decisions have led to tangible results. Increased website traffic, higher conversion rates, or improved customer lifetime value – these quantifiable results prove the value of your content marketing and secure continued investment.
By constantly analyzing data and adapting, you create a positive cycle. Content quality improves, engagement goes up, and your marketing becomes more predictable. This data-driven approach empowers you to create content that not only connects with your audience but also gets real business results. This is core to the philosophy at Trace, where we focus on simple, data-driven systems that actually work. We concentrate on the fundamentals and avoid unnecessary complexity, making it crystal clear what's driving your business forward.
Your Content Performance Tracking Action Plan

So, we've covered a lot of ground. Let's map out how to actually use all this information. Whether you're just getting started with tracking or your current system is a tangled mess, a clear plan is essential. This is where we move from theory to practice.
Prioritize Your Actions
First, pinpoint your biggest headache. Is it data scattered everywhere? Are your goals unclear? Maybe you're drowning in tools? Pick one thing to focus on. Think of it like organizing your home – you wouldn't try to tackle every room at once. Start with one, get it sorted, then move on.
If you're starting fresh, setting up Google Analytics and defining key metrics is job number one. Don't worry about fancy dashboards just yet. Nail the basics first.
If you already have a tracking system, give it a thorough audit. Are your UTM parameters looking like a bowl of alphabet soup? Do your Google Analytics goals actually reflect your business objectives? Sometimes, just cleaning up your existing system can make a huge difference.
Tool Selection Based on Your Needs
Choosing the right tools is key. For smaller teams on a budget, free tools like Google Analytics and UTM.io can be surprisingly powerful. As your team and budget grow, consider investing in more advanced platforms that offer deeper insights and automation. I've seen firsthand how the right tool can unlock a whole new level of understanding.
Measure Your Progress and Iterate
Content performance tracking is a marathon, not a sprint. Set achievable goals and celebrate the small victories. Don't expect to transform your results overnight. It's like tending a garden – you need to consistently nurture it to see the fruits of your labor.
Regularly review your data, adjust your approach, and always keep learning. What worked last month might not work this month. Flexibility is key. The digital world is constantly changing, so you need to adapt. At Trace, we live by this principle.
Finally, getting buy-in from stakeholders is critical. Show them how your tracking connects to real business results. Demonstrate the value by linking content performance to business outcomes. This not only justifies your work but also secures continued support for your content marketing initiatives. Consistently proving the value of your work builds trust and credibility, solidifying your position as a data-driven content strategist.